
Microsoft Access database makes it so easy for you to create
or design standard and professional reports using some previously created
tables and queries as data sources and to present them in enticing formats
using different methods. MS Access also gives you many options and ways of
building the reports with less stress. In this tutorial part, I will explain
all about report as one of the objects of a database and how to create reports using
the various available methods.

BUILDING STANDARD AND PROFESSIONAL REPORTS IN MS ACCESS
Report is one of the objects of Microsoft Access database
that is used to prepare a database in a format suitable for print out. This is
because you have control over the size and appearance of every item and you can
display information the way you prefer using report object. It is also used to
perform calculations.
In the previous chapter (Chapter 6), I explained how to learn and build databases in Access and MySQL through SQL in detail. Also see the full tutorial course content of this Microsoft Access Tutorial Series.
Reports are a great way to organize and present data from
your Access database. Reports enable you to format your data in an attractive
and informative layout for printing or viewing on screen. Reports are often
used to present a big-picture overview, highlighting main facts and trends. The
data in a preview or in a printed report is static.
Reports merely present the data; they do not alter the
underlying data in the tables. Each time a report is opened, Access displays
the most recent data. I will advise you to first create a functional report
before formatting it to give it a professional look.
COMPARING ACCESS REPORTS AND FORMS
Although there are many similarities when working with forms and reports, there are a few major differences also.
1. Reports only display data, whereas forms allow you to display and
edit, add, and
delete data.
2. Command buttons are often used on
forms but are rarely used on reports.
3. Reports have slightly different design sections compared with forms.
The last bullet point is worth explaining in
much greater detail. As you may recall from Chapter 3, forms have a Form Header, a Form Footer, and a Detail section. Anything in the Form Header displays at the top of the form, and anything
in the Form Footer displays at the bottom of the form. The Detail section is where the actual form data display and where most of the form controls are placed.
UNDERSTANDING ACCESS REPORT SECTIONS
Reports are a bit more sophisticated
when it comes to displaying and grouping data, so reports contain additional sections that provide this functionality. All
reports have Report Header, Page Header, Detail, Page Footer, and Report Footer sections, and special reports that display grouped output will also have
Data
Header and Data Footer sections. In addition, a grouped report will have a separate Group Header and
Group
Footer
for
every grouping
level of
data.
Below are some of the
sections of a report.
Report Header: Controls in this section will display at the very top of the first page of a report. This means that the report header is
found only at the first page of a report in MS Access.
Page
Header: Controls in this section will display at the very top of every page of a report. They
will appear immediately after the Report Header on the first page of
the
report.
Group Header:
This section appears on a report only if you display the report data in a grouped fashion.
Every grouping
level of data will
have a separate Group Header named after the control being
grouped. Normally, this section
will
contain a textbox to display the field you are
grouping the report data on.
The
data result will
appear only once for each unique grouping
section.
Detail section:
The detailed record-by-record
data appear in this section of the report.
If the
report is being
grouped, it will display every record
within that group and
then
continue to the
Group
Footer
section.
Group Footer: This optional section appears on a report only if you display the report data in a grouped fashion. Every grouping level of data will have a separate Group Footer named after the control being grouped. Normally, this section will contain a calculated control to summarize the records in the Detail section. Often, records for each group will be counted, averaged, or totaled.
After this section is displayed for one unique grouping, the report will return to the Group Header and then display the results for the next data grouping. The iteration over the Group Header, Detail section, and Group Footer continue until every unique data grouping is displayed.
Page
Footer: Controls in this section will display at the very bottom of every page of a report.
Report Footer:
Controls in this section will display on the last page of a
report immediately after the last Detail section records and Group Footer results are displayed.
I will illustrate
these report section when later while explaining how to design reports through
the Design Report method in MS Access.
GETTING STARTED WITH REPORT DESIGNS AND FEATURES
Well-designed reports should be organized, grouped, sorted, and presented in a manner that is useful for the end user of the database. If you are building reports that other people will be using
or
viewing, it is
critical that you involve them in the process of designing the report to ensure that it meets their needs. It
is very helpful
if the end user can provide you with an existing paper report that matches the format and
design of the report you are building. If a report does not exist, you should work closely with the end user
to develop a hand-written mockup of how the report should look. This will then become the basis for your
design of the Microsoft Access report.
Once you have a paper design of the report, the next task is to figure out what table or tables your report
data come from. If you need to display data from multiple tables in your report, you will first need to build
a query, or if using the Report Wizard, Microsoft Access will build the query for you. That table or query is then
assigned to the Record
Source property of
the
report (just like forms).
AVAILABLE VIEWS OF A REPORT
The available views for the report as object of a database
are:
1. Report view
2. Print Preview
3. Layout view
4. Design view
Each view has its distinct purpose,
advantages, and disadvantages that are summarized
here. While building
database reports, you
will often switch between
these views.
Report View:
This view is used for viewing all of the report data, but it
does not show page breaks. You cannot make any design changes in the Report
View, but you can apply and remove data filters and instantly see how the
output updates.
Design View:
This view provides the most powerful way to work on the
design and layout of the report. In this view, you cannot see any of the report
data.
Layout View:
This view is a combination of Report View and Design View.
It enables you to make most design changes to the report while viewing live
report data. It is very powerful because it instantly allows you to see how
design changes will appear on the report with data. In this view you cannot
edit the form data.
Print Preview:
This view enables you to see all of the report data and pagination
exactly how it will appear when the report is printed. You cannot make any
design changes to the report in Print Preview.
NOTE:
To see the available views for a report, open a
report or create a new one and then click the View drop down arrow in the Views
group under the Home tab as
shown below.

METHODS OF CREATING REPORTS
Reports are created from one or more tables or queries. To
use several tables, you would first create a query to retrieve data from those
tables.
There are three major method or ways of creating
a report in MS Access. They include:
1. Auto Report Method
2. Through Design Report
3. Through Report Wizard
AUTO REPORT OR ONE-CLICK REPORT METHOD
This is a fast and automatic method that is used to create a
report using default design. All you need to do is to highlight your data
source and Access does the rest for you. It creates a basic report of the data
in the current query or table to which you can add features such as groups or
totals.
The one-click report generating approach gets you started in
a hurry, but it’s not as convenient as it sounds. Most tables have quite a few
fields, and an automatically generated report includes them all. The resulting
report is often so wide that it stretches right off the edge of the page. You
can remove and resize columns after you create the report to solve the
problem), but you’ll also need to move the page number and resize the report in
Design view. With all that trouble, it’s usually easier to create a blank report
and then add the columns you want under the Design view.
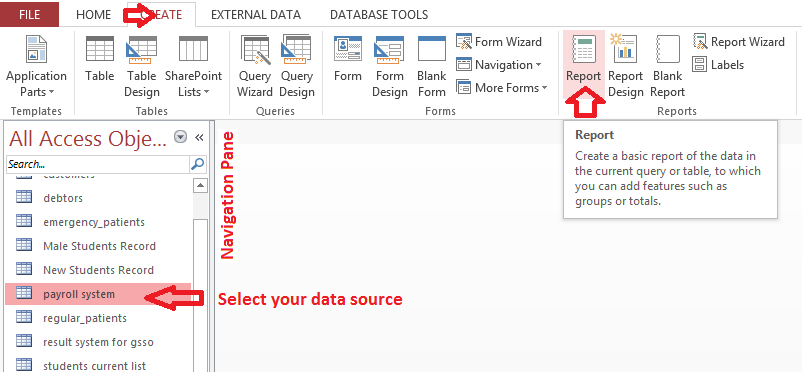
To Create a Report through Auto Report (One-Click) Method:
1. Highlight your data source (which could be either table or
query) for the report in the Navigation pane
located extreme right of the Access window.
2. Click the Create tab.
Then click the Report icon under the
Reports group as shown below.
3. MS Access quickly creates a report using the data from your
specified data source and opens it in the Layout
view as shown below.

4. You can view it through the Design view and make some
changes to the default design if you wish. Save the report with a unique file
name when you are through and close it up.
CREATING REPORTS USING REPORT THE DESIGN METHOD
This is another method of creating reports in MS Access. It
allows you to create a report from the scratch and to your own taste. You first
create a blank report and then add data from any table or query of your choice through
the Field List Pane and also add custom control types and writing codes.
To Create and Customize a Report from the Scratch:
1. Click the Create tab.
Then click the Report icon under the
Reports group and switch it over to Layout view.
2. Next, pick your table in the Field List. To add fields to a
report, you need the help of the Field List pane. Access shows the Field List
pane automatically when you create a blank report, but if you’ve accidentally
closed it, you can show it again by choosing Report Layout Tools > Design
> Add Existing Fields (under the Tools
group) as shown below.

3. At first, Access doesn’t know what to display in the Field
List pane because it doesn’t know what table you want to use. It’s up to you to
choose one. Click “Show all tables” link and find your data source table in the
list, and click the tiny icon next to it (the square with the plus sign in it)
to expand the table and show all the fields it contains.
NOTE:
Most times, your report fields will come from a
single table. But you can also add fields with related information from a
linked table.
4. Next is to add your columns to the report. To add a column,
click the field in the Field List, drag it over to your report, and let it go
in the appropriate position. When you add a new field, Access uses the field
name for the column heading, which isn’t always what you want. Luckily, you can
rename a column or field directly in your report. Just double-click one to
switch it into Edit mode. You can then edit the existing text or replace it
altogether.

6. Next, add any other report elements you would want to include in your report, like a title, a logo, page numbers, and the date.
— The title is the large-text caption that appears at the top of the first report page.
— The logo is a tiny picture that usually sits in the top-left corner of a report, next to the title.
— Page numbers indicate the current page (and, optionally, the total number of pages) in a printout. But in Layout view, Access treats the report as though all the data occupies one page, so you need to scroll to the end to see this element.
— The date information indicates the day and time that the report was run. Ordinarily, it appears in the header section, to the right of the title. Once you print a report, the date information tells you how recent (and therefore how relevant) your information is.
To add any of these elements, navigate to Header/Footer group under the Report Layout Tools > Design tab. Check the second to last screenshot above.
7. Now, fine-tune your report by adding some finishing touches; like changing fonts, colors, and borders. Change the headings, add a logo, tweak the borders, or apply page numbers.
8. Save your report to use later or print it now by pressing Ctrl + P.
CREATING REPORTS THROUGH THE REPORTS WIZARD
The Report wizard is another method of creating a report. It
is a step by step and best method to create a report because it allows you to
group or specify the way each data should appear on the report printout and
also allows you to specify the field with which the records will be sorted.
I strongly recommend that you use the Report Wizard to
help you when creating a new report. The Report
Wizard provides a great professional framework that you can then customize and build upon. Often, the Report Wizard
can build about 70% of the report for
you
instead of
you
building every single piece of the report from scratch.
In addition to the Report Wizard, there is
also a separate Label Wizard that is used for creating and printing mailing labels.
There are hundreds of canned
label formats stored in Microsoft Access, and
you
can also create custom label sizes if necessary. In the wizard, you
can easily filter the label sizes by manufacturer, and
then select the product number of your
blank mailing labels. The Label Wizard
will do the rest to ensure that the label spacing and
printing works properly for your labels.
To Create a Report Through the Report Wizard:
1. Click Report Wizard located in the Reports group under the Create tab. This prompts the report
wizard dialogue box.
2. Select the data
source table or query and then choose the field name you wish to include their
data in your report. Click the > or
>> button to select one or all
the field names at a time respectively. If you wish to remove one or all the
field names, use the < or << respectively. Click Next as shown below.

3. Specify if you want
to add a grouping level and then specify the field using the > button. It is optional. When you
specify the grouping field, the Grouping
Option button becomes activated. You can click this button to see more
grouping options. Click Next.
4. Specify a sort
order and a field with which the records will be sorted either in ascending or
descending order if you wish. You can sort your records by up to four fields.
Click Next as shown below.

5. Specify
how you want the records in your report to be. Select any layout option from the 3 available options: columnar, tabular (the
default) and justified. Then select
a layout option from the 2 available options: portrait (the default) and landscape.
Also check the box below so that Access adjusts the column width to accommodate
all your fields as shown below.

6. Select any background design of your choice. Type in the
report name. Click Finish.
MS Access then displays a preview of the report. Sometimes
the preview may terminate suddenly. It is due to the printer setting of your
computer.
This is the end of chapter part 1 of chapter 7 of this FREE online MS Access tutorial training series.

Click Here to know more about the book.
In the next part (part 2), I will give you the step by step guide on how to create a mailing label and different types of charts in MS Access.
Recommended MS Access Textbook
Get this book (Kindle format): Designing Professional Database Management Systems Using Microsoft Access 2013 and 2016 and MySQL.
Click Here to know more about the book.
In the next part (part 2), I will give you the step by step guide on how to create a mailing label and different types of charts in MS Access.
Was this tutorial helpful to you?
Inform your friends about this post by clicking the share button below. Comment below if you are hooked up along the installation process.
Also click Here to subscribe for free so that you will get our latest game updates in your email.


 Apk + Obb Data File")
, Median & Mode in Excel")


No comments:
Post a Comment
WHAT'S ON YOUR MIND?
WE LOVE TO HEAR FROM YOU!